Using Microsoft Excel
2007
Case6:
Create an excel with below data :
Now, highlight A1 till D10.
Click Insert ->
Pivot Table -> Pivot Table
Click ok.
In the new worksheet, drag the Day inside Row Labels.
Drag the sales inside Values as below
To change the Sum of Sales to Average of Sales -> Click
the small down arrow near Sum of Sales -> Click “Value Field Settings”
Select “Average” as below
Click OK.
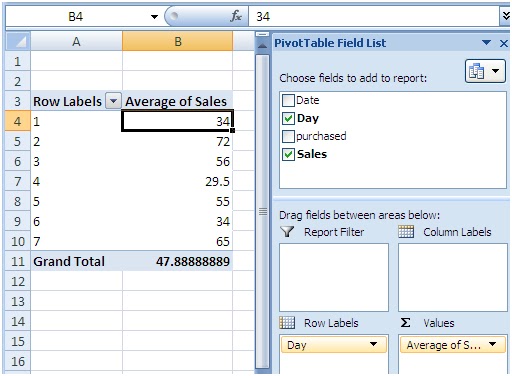
Now, the data shows on an average, on Monday, Tuesday, wed, fri, sat, sun, what
is the sales average as below:
Now, we want to highlight any sales less < 50 in red and
above 49 is green.
To do this,
Highlight B4 cell.
Select Conditional formatting -> Manage rules as below:
It will display below screen
Click new Rule.. button
In the below screen,
Select “All cells showing “Average of Sales” values
Highlight “Format only cells that contain”
Enter the range from 0 to 49 as below:
Click Format button in the above screen,
Select “light red” color as below
Click Ok.
Click ok.
Click New Rule.. button again.
In the below screen,
Select “All cells showing “Average of Sales” values
Highlight “Format only cells that contain”
Enter the range from 50 to 100 as below:
Click format -> select “light green” color. Click Ok.
Click Ok.
Click Ok.
You will see color coding as below:
Done
Continue Case Study:


No comments:
Post a Comment